Silver's structural shift
An analysis about the surge in silver price and a niche leader with a revenue CAGR of more than 20% since 2020

Hi friends,
The first article of the new year is here. In this edition, I dive deeper into the evolution of silver prices and the key drivers behind them. We will explore the wide range of applications and the robust demand currently being generated. Within these fields of application, I highlight a company that is a global leader in its specific industry and has succeeded in growing its revenue by more than 20% annually since 2020.
I hope you find it valuable!
The crazy rally of silver
The remarkable rise of silver has been discussed several times in Cash & Compound’s weekly review. In 2025, the price of silver surged by more than 150%. This price action is extraordinary, to say the least, especially considering we are talking about a precious metal. To put this into perspective: if you had invested in silver at the end of February 2013, you would have had to wait until May 2024 to see your first positive return. We are not talking about a memecoin here, but a scarce commodity; the amount of silver that can be mined globally is finite.
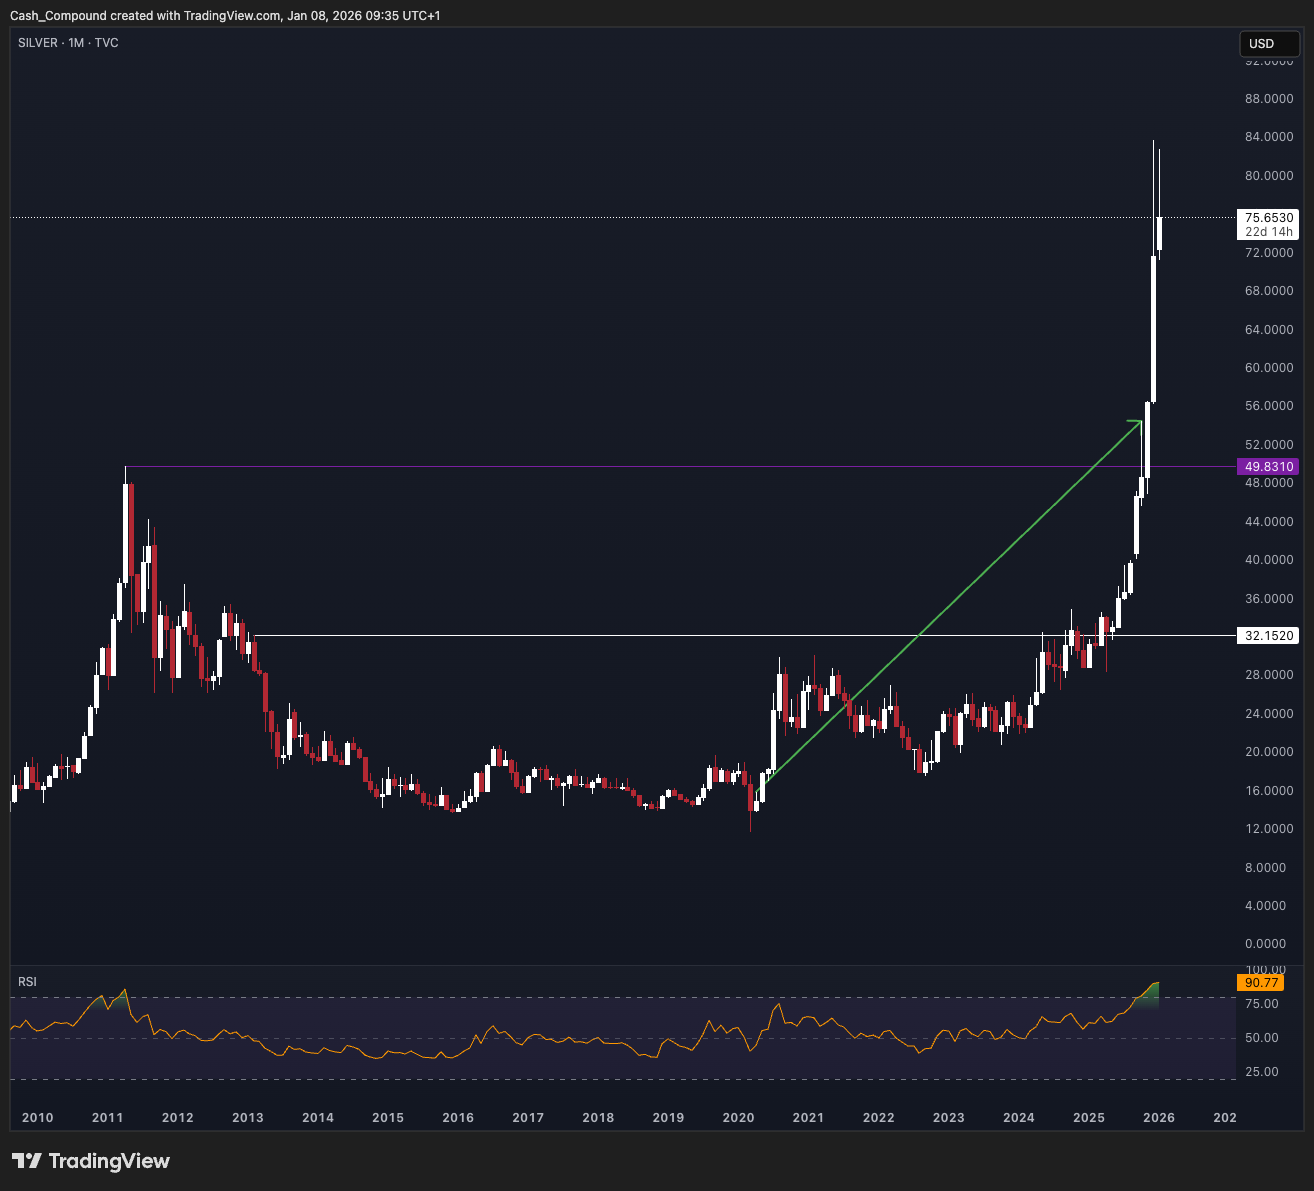
The price is driven by fundamental economic laws: supply and demand. Meeting current demand appears nearly impossible due to a structural deficit. In 2025, silver experienced its fifth consecutive year of global supply shortages, with estimated annual deficits exceeding 200 million troy ounces and declining liquid inventories.
Demand for silver has surged due to its numerous industrial applications, which we will discuss in more detail later. Currently, industrial use accounts for approximately 60% of total silver demand.
Beyond industrial demand, the climate for precious metals has been highly favorable:
Interest rate cuts: The U.S. Federal Reserve lowered interest rates, making precious metals more attractive as a store of value. While fixed-income products become more appealing when rates are high, falling rates reduce the opportunity cost of holding non-yielding assets like silver.
Currency weakness: This trend was further supported by the decline of the U.S. dollar over the past year.
Debasement trade
Finally, silver has become a focal point for the so-called "debasement trade." This is an investment strategy where investors flock to hard assets to hedge against the expected devaluation of fiat currencies—most notably the U.S. dollar over the past year. In this context, silver serves as a hedge against currency debasement caused by government deficits, monetary expansion, and inflation. It is a modern response to a historical phenomenon where the precious metal content in coinage was systematically reduced.
The source: silvermining
Silver is primarily extracted from ores where it occurs as a by-product of other metals such as lead, zinc, copper, or gold. The production process involves extraction, processing, and refining. Approximately 70-80% of silver production originates from this by-product mining, which makes the supply relatively inelastic and unresponsive to price changes.
Zinc, lead, and copper represent the primary ores from which silver is derived as a by-product. The amount of silver mined globally is distributed roughly equally among ores of zinc (sphalerite), lead (galena), and copper (chalcopyrite). Additionally, a small portion of global silver production is recovered as a by-product of gold mining.
Comparison with 1980
Between 1979 and 1980, the price of silver exploded from approximately $6 to a peak of $50 per ounce, which meant an increase of over 700%. This was largely driven by the speculative maneuvers of the Hunt brothers, two Texan oil tycoons convinced of the hedging value of precious metals against double-digit inflation, which was around 13-14% at the time and a weak dollar following the end of the Bretton Woods system. Starting in 1973, they began accumulating massive amounts of silver through physical purchases and futures contracts, financed by heavy leverage and oil profits. By the end of 1979, alongside Arab partners, they controlled approximately 200 million ounces, nearly half of the world’s identifiable supply, stored in Switzerland and held through interests in mining companies. This created a classic short squeeze on the COMEX, as short sellers were forced to make physical delivery.
Geopolitical tensions, such as the Iranian Revolution and the Soviet invasion of Afghanistan, further boosted safe-haven demand. However, the Hunts’ dominant position drew public criticism (notably from juweler Tiffany & Co.) and led to COMEX regulatory changes, such as “Silver Rule 7” (January 1980), which restricted leverage. On Silver Thursday (March 27, 1980), the price plummeted by 50% in a single day due to margin calls and Fed intervention, resulting in billions in losses for the brothers and the implementation of stricter market regulations.
The Current Market Rally
The surge in silver prices we are currently experiencing is not driven by central figures like the Hunt brothers, but rather by structural deficits where supply simply cannot keep pace with demand. That said, a short squeeze has played a role in pushing prices higher. A short squeeze in silver occurs when short sellers are forced to close their positions as prices rise, creating additional buying pressure that drives prices even higher. In this instance, the catalyst was physical shortages, which further intensified demand for the metal.
Despite the massive surge we have seen in the silver price, it is important to note that 1980 and 2025 cannot be compared directly. When we factor inflation into the calculation, rather than looking strictly at the nominal price per ounce, we see that silver is actually not that expensive today compared to its 1980 levels.
When you view this through the lens of today’s significantly expanded industrial applications, it becomes clear why the price has risen so sharply. Unlike in the past, current demand is underpinned by essential modern technologies, making the current price action fundamentally different from previous speculative peaks.

Central banks are on the buying side
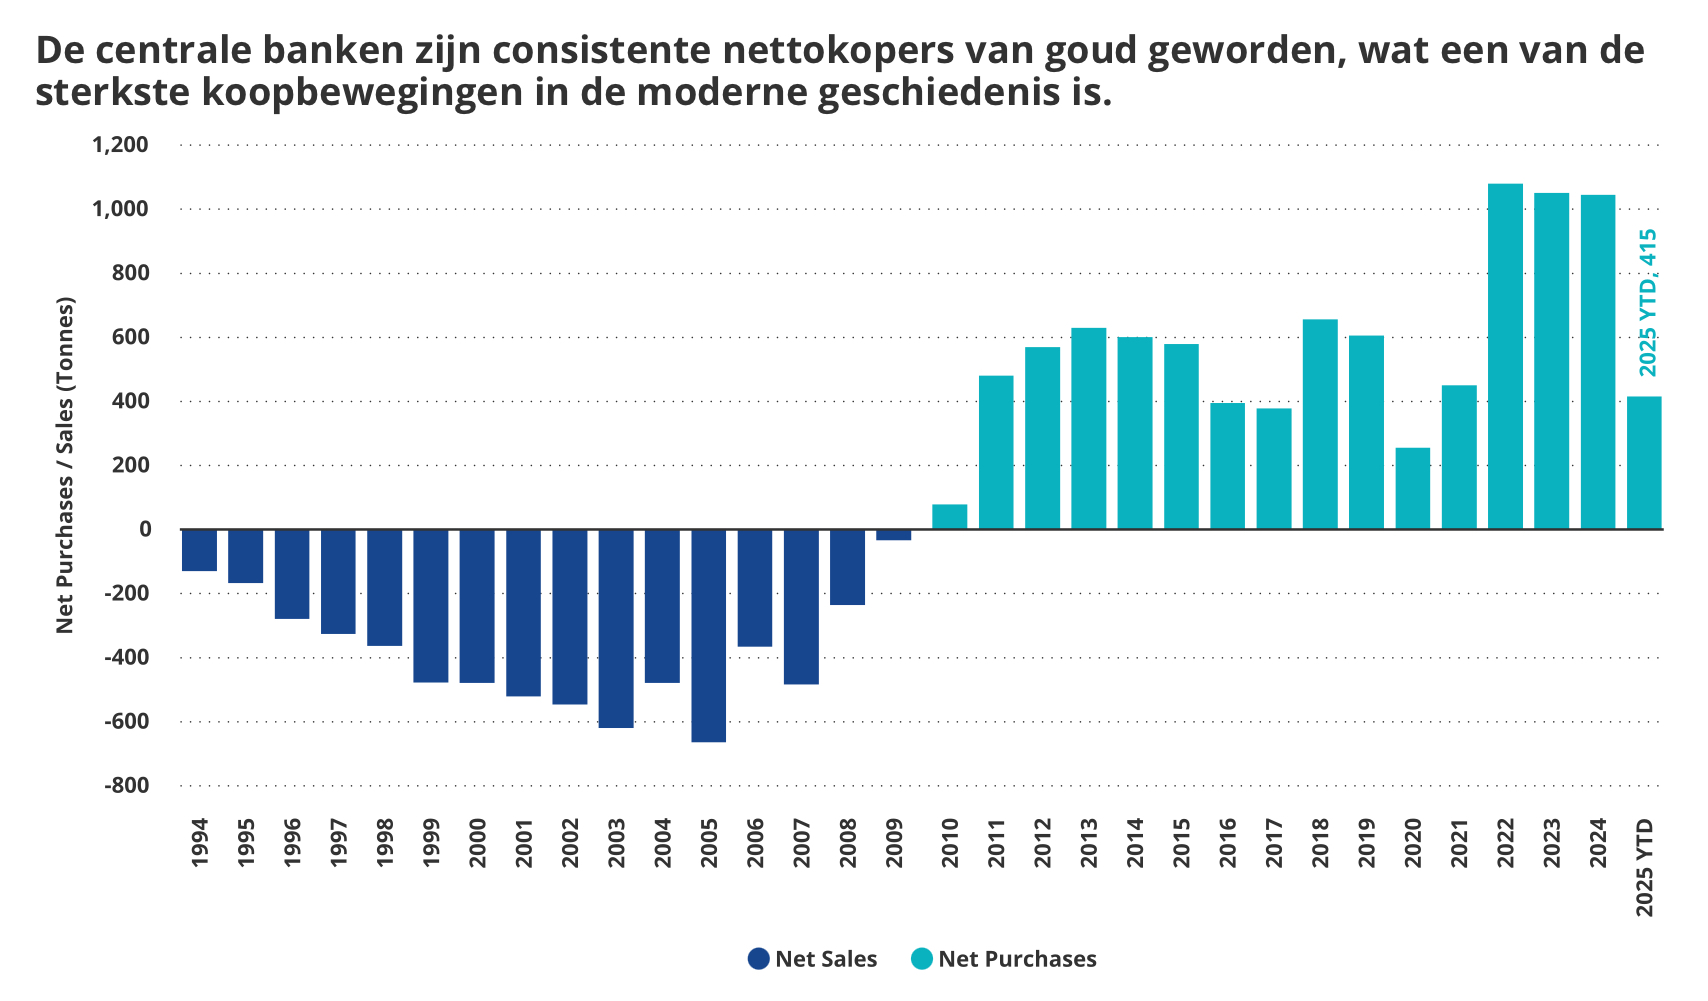
Central Bank diversification and de-dollarization
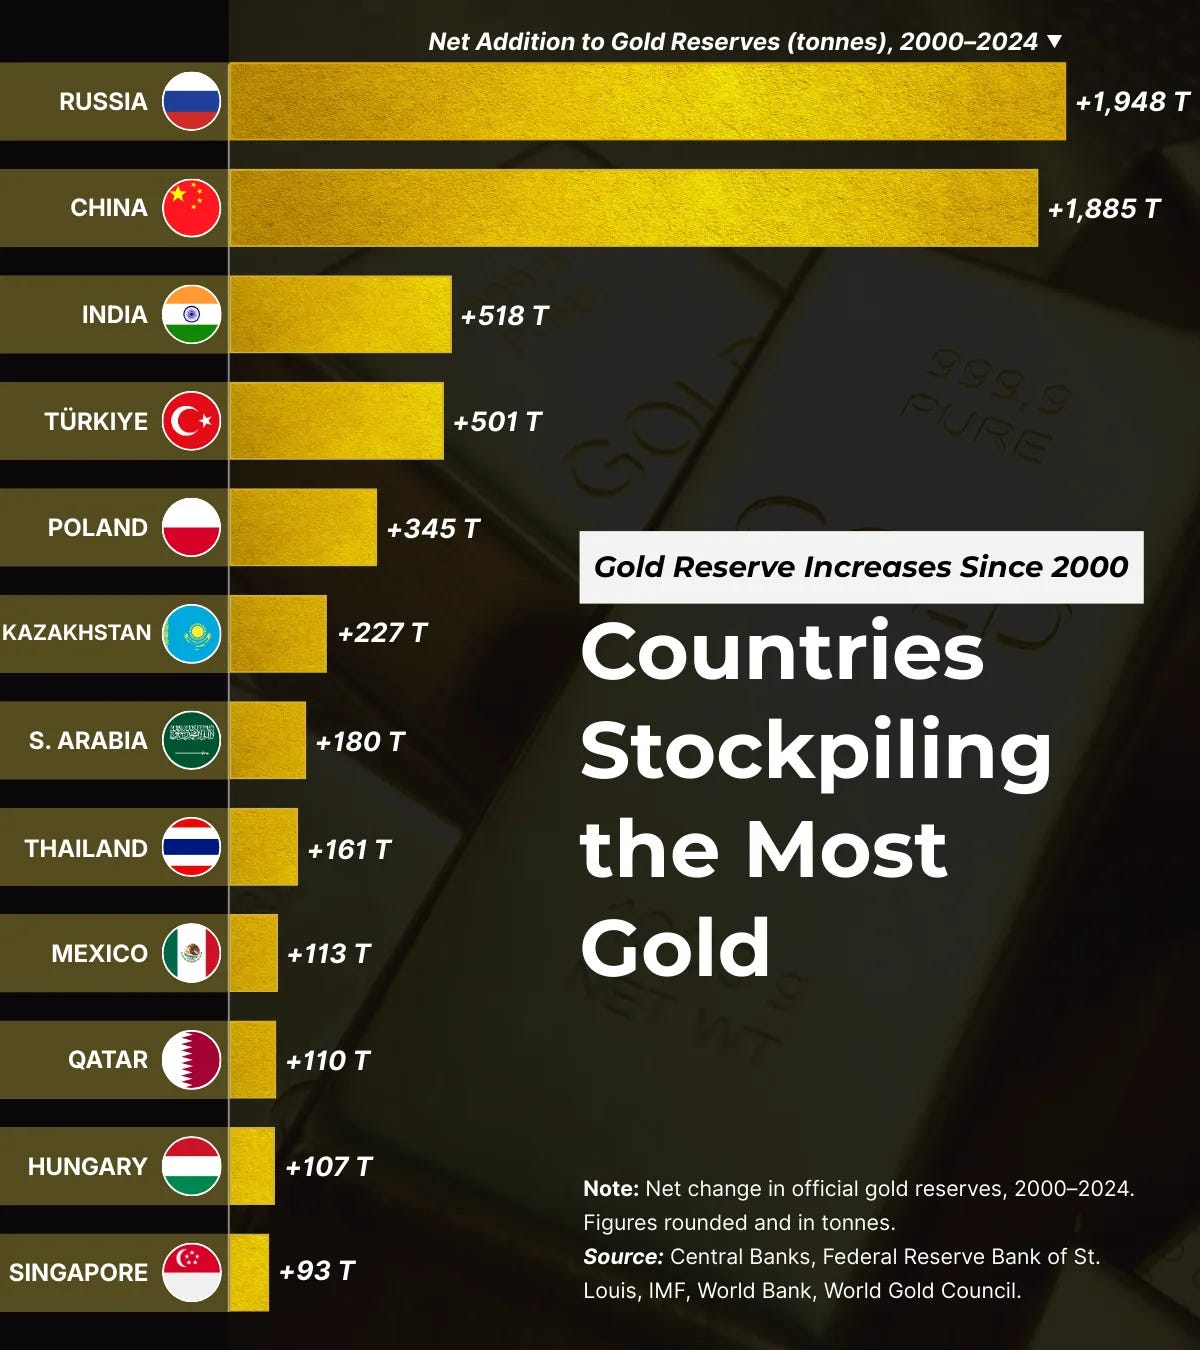
Since the early 2020s, central banks worldwide have significantly increased their gold reserves, with annual purchases exceeding 1,000 tonnes, which is double the volume of the previous decade. Consequently, gold’s share of total reserves rose to approximately 27% in 2025, while the share of U.S. dollars and Treasuries fell from over 30% to 23%. This resulted in a historic reversal, where the total value of gold reserves surpassed the value of U.S. Treasuries for the first time since 1996.
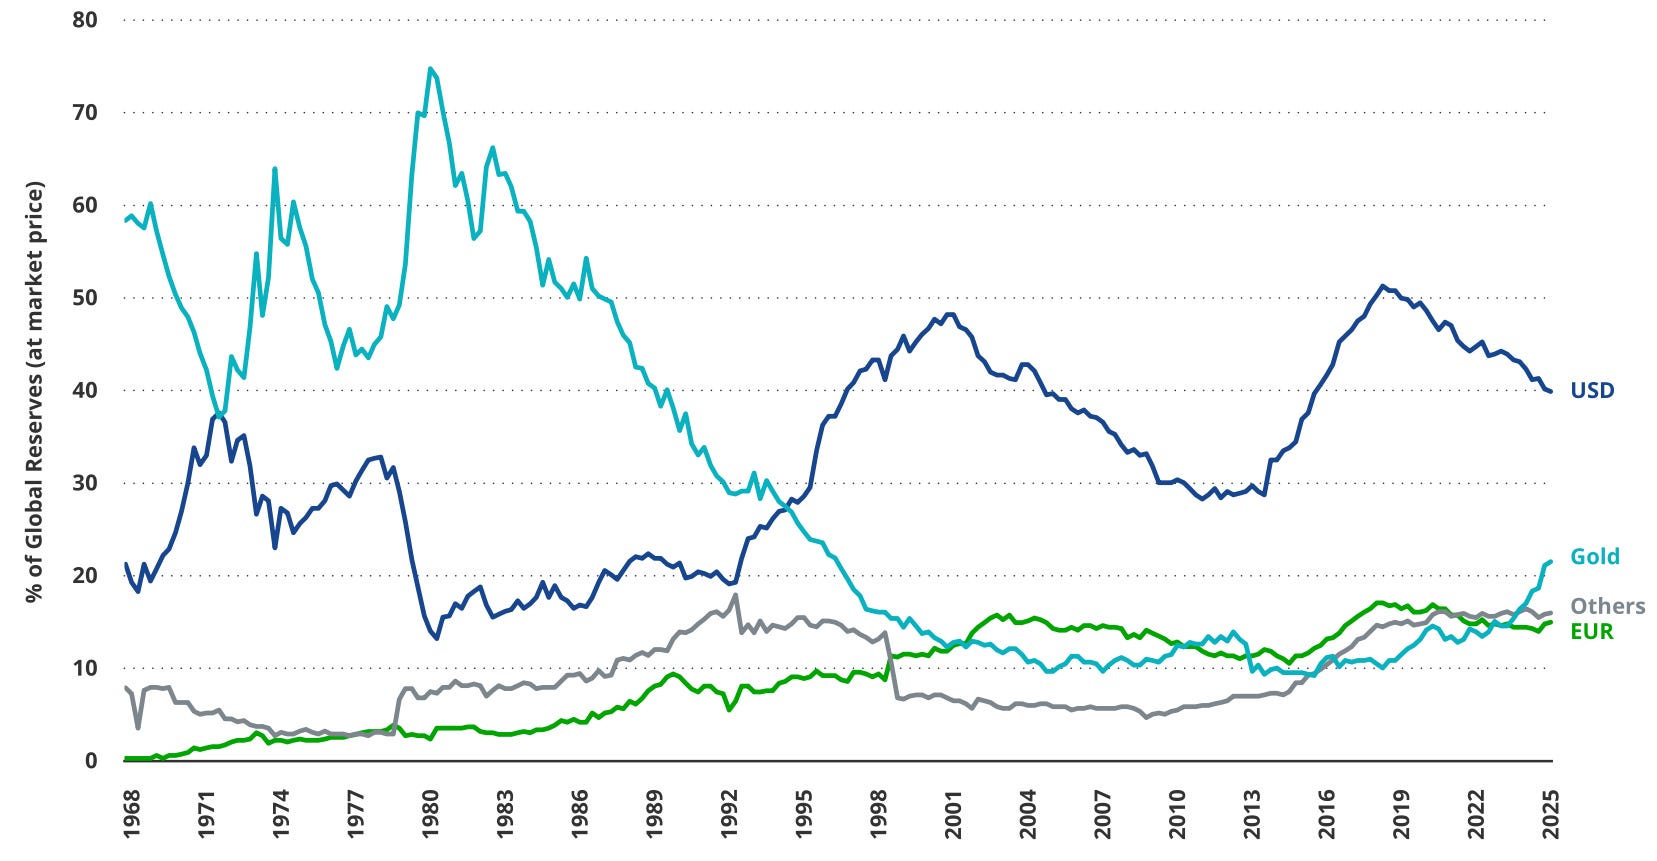
This shift toward gold is primarily driven by a desire to reduce dependence on the U.S. dollar (de-dollarization). This trend is fueled by geopolitical risks, such as sanctions and the freezing of Russian assets, as well as concerns over U.S. fiscal deficits and monetary instability. Furthermore, central banks value gold’s intrinsic worth as a neutral hedge against inflation, currency devaluation, and the weaponization of finance. Emerging markets, most notably China, Russia, India, and Turkey, have emerged as the most significant buyers in this transition.
The sharp rise in gold reserves held by Russia and China reflects a broader goal: reducing dependence on the U.S. dollar. In response to Western sanctions, Russia has intensified its de-dollarization strategy, turning to gold as a safeguard against potential asset seizures or currency devaluation.
China’s approach is equally calculated. Amid ongoing trade frictions with the United States and an ambition to elevate the yuan’s global role, Beijing has quietly built up its gold reserves—often through subtle central bank purchases and reported transfers from domestic mining operations.
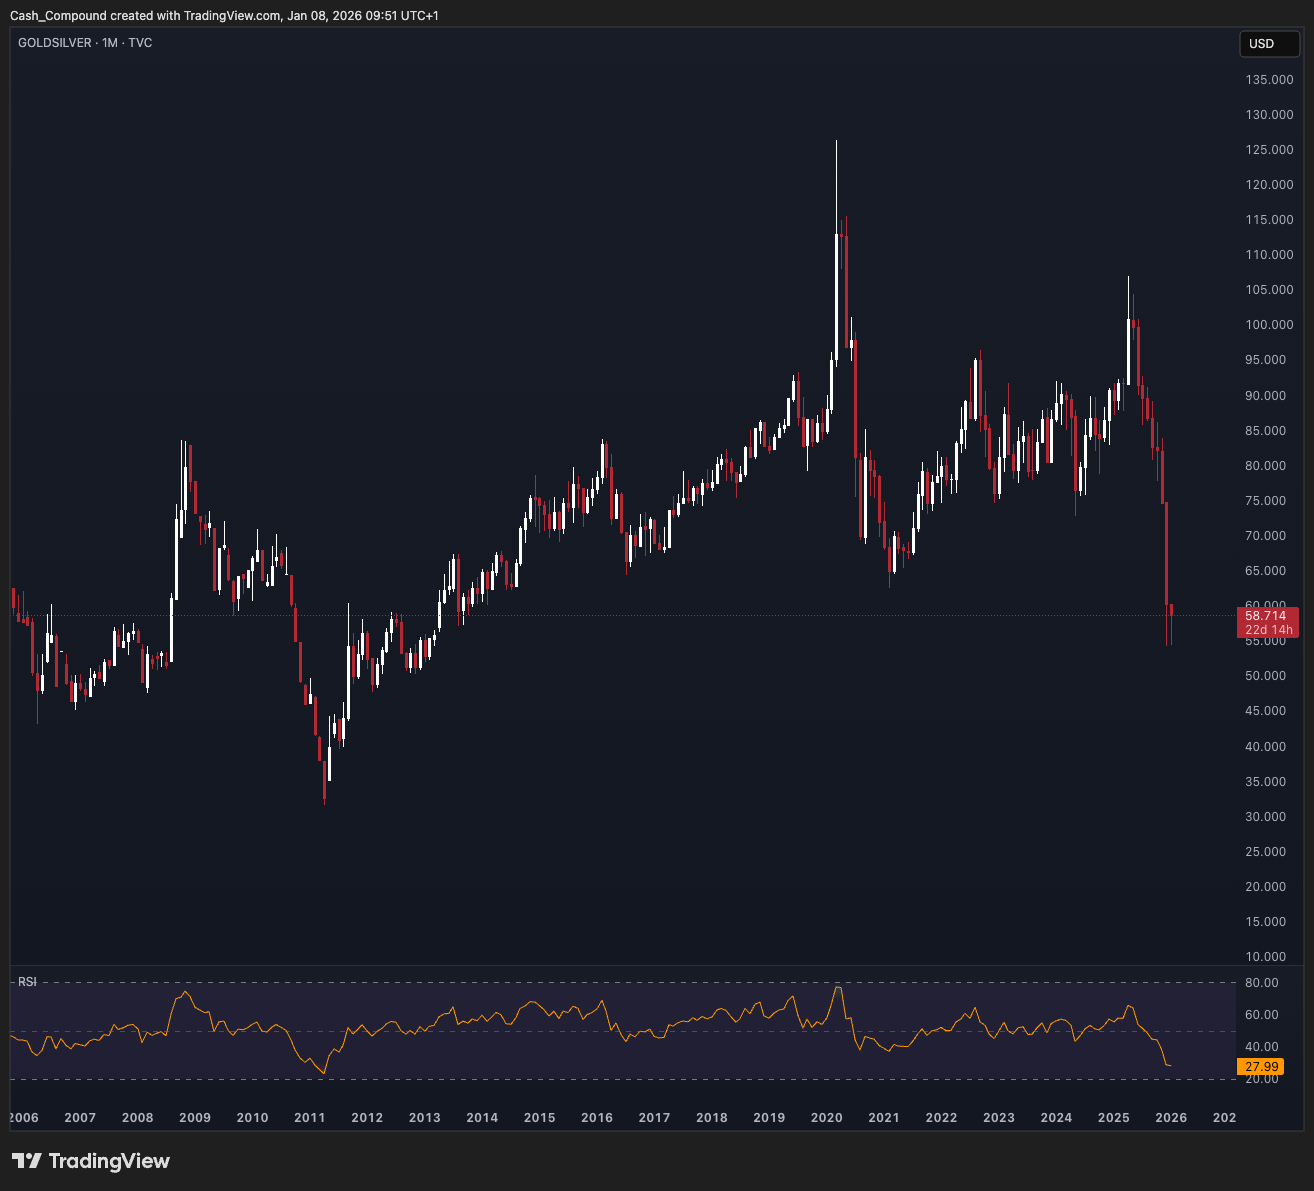
This development underscores a global realignment of currency reserves: as the dollar's share in official reserves declines, the share of gold continues to rise as a neutral, non-sovereign safe haven. These central bank purchases have naturally driven gold prices higher. Historically, the gold-to-silver ratio had been steadily increasing, suggesting that a significant rise in silver was necessary to bring the ratio back toward its long-term average.
In April 2025, we saw the gold-to-silver ratio peak above 100 once again, reaching levels not seen since 2020. Back then, we also witnessed a sharp decline in the ratio shortly after, which implied a significant appreciation in the price of silver. Given the current sentiment, where macroeconomic conditions continue to cause uncertainty, it seemed unlikely that the gold price would drop anytime soon.
Consequently, for the gold-to-silver ratio to revert to its long-term average, the price of silver had to rise. When taking both this ratio and the industrial applications of silver, which we will discuss afterwards, into account, a price surge was, in many ways, to be expected.
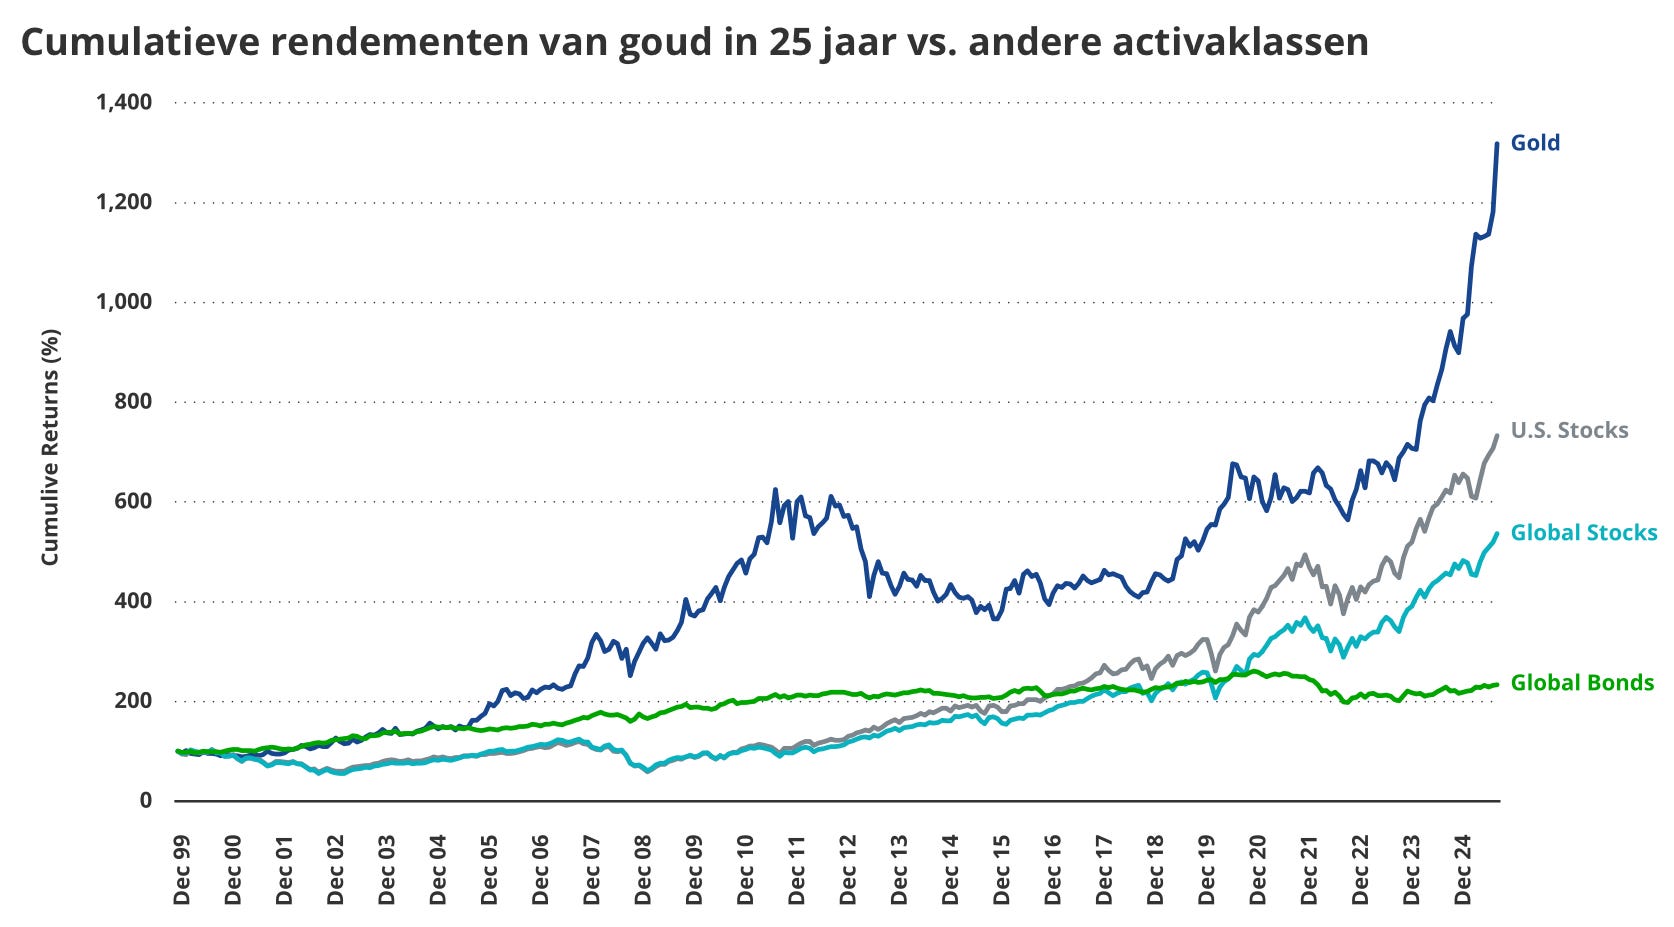
Historical performance
Since 2008, gold has outperformed U.S. equities and government bonds during the most notable market crises. This reflects gold's role as a hedge against financial risks amidst uncertainty. However, potential risks include prolonged periods of rising real interest rates, shifts in central bank policies, or sustained strength in the U.S. dollar. All of which could weigh on gold's long-term performance.